This topic describes how to print and export your discoveries when using either Discover Pro or Discover Lite. While the general workflow between the two apps is similar, there are some minor differences depending on your edition or license which are noted throughout.
Note: Discoveries do not need to have been saved to be printed and exported. Any dynamic interactions applied at the time of export (like drill down, dice, sorting, filtering, slicer interactions, and so on) are reflected in the exported content unless your settings indicate otherwise (if the Remove value-based filters option is applied for Excel, CSV, JSON, or XML output).
Opening the Print & Export dialog
The following options are all used to print the currently open report. Each opens the Print & Export dialog, where you can select your print and export settings.
Discover Pro Ribbon
In Discover Pro, click Print & Export in the Status Bar (green arrow below):
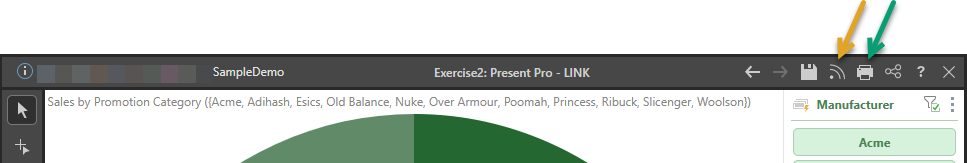
Tip: The Subscribe button (orange arrow above) also prints the discovery, but as part of an automated subscribe process. You can subscribe to print your discovery in the future, on a recurring basis, and even distribute the printed discovery to other users.
Discover Lite Ribbon
In Discover Lite, click the Print button above the Dimensions panel (green arrow below):

Chatbot
Alternatively, open the Chatbot and type print.
Print & Export dialog
The Print & Export dialog in Discover shares most of the same features as the print dialogs throughout the application.
Output tab
In the left-hand panel, select the format that you want to export your printed item to. The formats are PDF, PowerPoint, Word, Excel, HTML, PNG, Comma Delimited text (CSV), JSON, and XML and the formatting options are specific to your selection.
Graphic Output Types
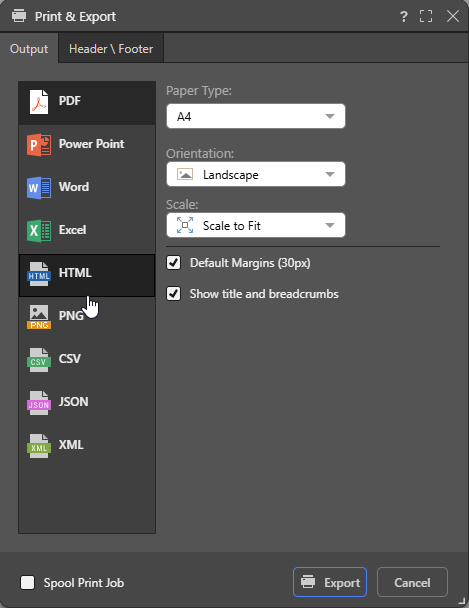
The print options for HTML, PDF, PNG, Power Point, and Word. When creating a PNG, only Image Quality and Scale are relevant:
Paper Type
Select the "paper size" that you want to use from the dropdown list. Tip: You should select a size that is appropriate to your region, like A4 or Letter.
Orientation
- Landscape: Make the output orientation landscape.
- Portrait: Make the output orientation portrait.
Image Quality
Set the image quality to low, medium, or high.
Scale
- Scale to Fit: Scale images to fit the output.
- No Scale: Don't scale images.
Default Margins
Set margins to the default size (30 pixels). Clear the checkbox to customize the margin size.
Show Title and Breadcrumbs
(PDF, PowerPoint, Word, and HTML.) Selecting the Show Title and Breadcrumbs checkbox adds the report title and the Light Breadcrumb trail to the exported file. The Light Breadcrumb trail describes the report hierarchies and measures, followed by any selected slicer values in parentheses.
Note: When you are exporting to an Excel spreadsheet, you can use the similar Show Title and Context options to add the title and breadcrumbs to your output file. For more information, see below.
Excel
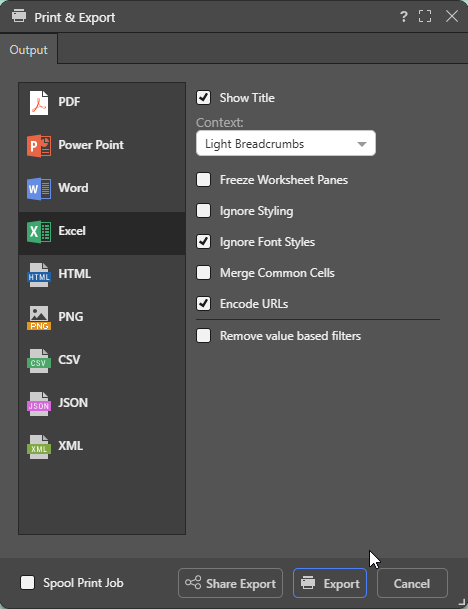
Once you have selected the Excel option in the Output panel, you can select the formatting options that dictate how your output should be formatted.
Note: When you export your content to a spreadsheet, the filters are typically applied to the output as set at time of printing.
Show Title
Select the Show Title checkbox to include the report name in the exported spreadsheet. By default, this value reflects the saved name of the report as seen in Discover (status bar and app tab).
Tip: You can override this value by specifying a Custom Value as the Title in the Report Title formatting options for the discovery. In this case, the custom value is shown both on the canvas and in the exported spreadsheet. Note that, if you select Breadcrumbs from the Title field, the title in the exported spreadsheet will either be the Custom Value (where a custom value is defined) or the saved report name (where a custom value is not defined).
Context
Select an option from the Context dropdown list to describe the filtering associated with the discovery:
- Light Breadcrumbs: Include a row describing the report hierarchies and measures, followed by selected slicer values in parentheses.
- Enumerated Breadcrumbs: Include a row describing the report hierarchies and measures, followed by the slicer name and selected slicer values as colon-separated pairs.
- Explicit Details: Add all Breadcrumb details to the spreadsheet as a table of details. The details include Slicers and Parameters and their selected values and details of any Sort and Filter captions that are currently filtering the content of the visual.
- None: Don't include any context information.
Freeze Worksheet Panes
Not relevant to Grids. Freeze the panels in your worksheet to keep the header information (title, visual, context, and the header for the data table) visible while you scroll through the data in the rest of your worksheet.
Ignore Styling
Matrix Grids only. Do not export styles from the source to the target spreadsheet.
Ignore Font Styles
Matrix Grids only. Do not export font styles from the source to the target spreadsheet.
Merge Common Cells
Matrix Grids only. Where adjacent or contiguous cells contain the same content, merge those cells. This has the same effect as the Merge and Center tool.
Encode URLs
Select the Encode URLs checkbox to automatically replace some "unsafe" characters in URLs, such as spaces, colons, or slashes, with their corresponding encoded values. For example, selecting this option replaces ?search=hello world with ?search=hello%20world in the exported spreadsheet.
The relevant "unsafe" characters are: < > \ / ? & # : ; = and Space.
Remove value-based filters
Where a value-based filter has been applied to data, select this option to remove that filter and export the entire dataset rather than only the filtered values.
Note: This option removes value filters and not slicer filters. As an example, it removes value filters that limit data based on values and metrics, such as top 10% of sales, but does not remove the filtering effect of slicers, such as where France is the element selected from a Country slicer. For more information, see Value Filtering in Discover.
Note: Printing or Exporting to Excel involves a number of adjustments to the export process. Click here for more details about this process.
CSV, JSON, and XML
Note: Exporting and printing to JSON, XML, and CSV is not available in the Community edition.
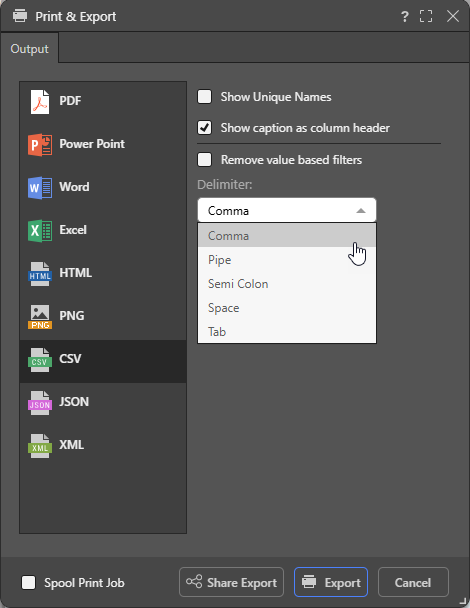
Show unique names
Include unique names for each value.
Show caption as column header
Include the caption as a column header. Where this option is not selected, the column header caption is null.
Remove value-based filters
Where a value-based filter has been applied to data, select this option to remove that filter and export the entire dataset rather than only the filtered values.
Note: This option removes value filters and not slicer filters. As an example, it removes value filters that limit data based on values and metrics, such as top 10% of sales, but does not remove the filtering effect of slicers, such as where France is the element selected from a Country slicer. For more information, see Value Filtering in Discover.
Delimiter (CSV only)
Indicate which character should be used as a delimiter in the CSV. This can be one of Comma, Pipe, Semi Colon, Space, and Tab.
Header \ Footer
In Discover, users can add headers and footers to the rendered pages. From the Header \ Footer tab:
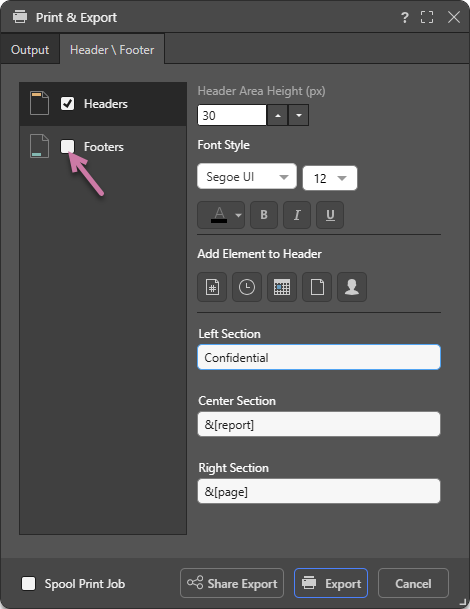
Enable Headers or Footers
- To enable headers, select the Header checkbox.
- To enable footers, select the Footer checkbox (purple arrow above).
Configure Headers or Footers
- Header \ Footer Area Height: Set the area height (in pixels) of the header or footer.
- Font Style: Select the font formatting options, including font type, size, text color (using the Color Picker), and emphasis (bold, italic, or underline).
- Add Element to Header: Use the buttons to copy a variable representing a page number, time, date, report name, or user name into the Left, Center, or Right Section of the header or footer. By default, each is added to the Left Section field, but you can select either Center Section or Right Section to copy the variable into that field instead.
- Sections: Add content to the Left, Center, or Right of the header or footer using the fields: Left Section, Center Section, or Right Section.
Note: Headers and footers that have been configured will only appear in the output if they are enabled.
Buttons
Spooling
Select the Spool Print Job checkbox (bottom left) to send the print job to the job spooler. This allows the engine to process the job in the background while you can continue using the application. When the print is complete, you can retrieve it from the spooler tool.
Share Export
Opens the Share Content dialog. You can share your artifact with other users (recipients), either by attaching the exported content to an email or by sending a Share Link to the recipient for access in Pyramid. For more information, see Share Content.
Related information
Data Source Authentication
If you’re using Windows Authentication or SAP Logon Tickets to connect to your data source, you may be prompted to enter Authentication credentials when saving your changes.
- Click here to learn more about Data Source Authentication.